As you're likely already aware, mercury content in seafood is a growing concern. Eating fish is probably good for you. Eating mercury is probably bad for you. What's an informed consumer who really likes tuna to do?
The other day, I was reading up on the argument in the academic literature about selenium concentrations(that's the element, not the browser automation) in seafood being a protective factor against potential mercury toxicity from consuming the seafood. Of course, the standard approach is to avoid or reduce consumption of fish known to have high mercury content. But in general, telling people not to eat something they think is tasty is often a hard sell. The selenium idea comes in under the principle of "harm reduction": if you can't convince someone to give up swordfish AND tuna AND mackerel, maybe you can convince them to stick with the tuna if it shows higher protective selenium. It increases options. Anyway, some studies show a benefit; others, not. Yet others indicate there's a relationship, but the effect is more complicated. In any case, it seems like dietary selenium concentration might be something that a consumer of fish might be interested in being able to make informed choices about. Unfortunately, when our consumer buys a product at the store with a nutrition label on it, at best it's going to look something like this:
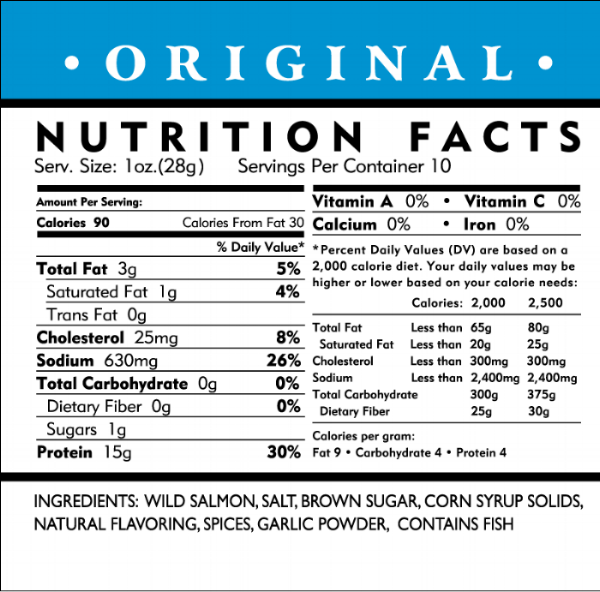
e.g. Alaska's Best Salmon Jerky. No endorsement, either for or against this product, is intended
The USDA regulates the information contained on nutrition labels, mandating that certain things be included. Selenium concentration is not one of those things. However! We have all of this other data. Perhaps we could use it.
The question I was trying to answer was, is there a simple, easily-useable statistical model or equation that could be applied to this data by a hurried consumer trying to get home to a healthy dinner? There isn't much point in an incredibly complicated model for this - maybe as proof of concept, but at that point, you might as well just look it up. The obvious candidate here is a regression model.
I wrote a script to scrape all the entries in the "seafood" category from nutritionvalue.org, which sources from the USDA, for selenium concentration as well as 11 common nutrition label entries. Those were protein; Vitamins A, C, and D; Iron; Sodium; Potassium; Calcium; saturated fatty acids (SFA); and poly- and monounsaturated fatty acids (PUFA, MUFA) for good measure. I took a look at the data, and graphed out a few of the variable correlations (all normalized). Some of them are kind of neat. As expected (some nice data validation), all of the fatty acids correlate pretty heavily.

You can see which vitamins/minerals are fat soluble and which ones aren't. Vitamin D, for example, is, while Potassium is not:

There are some things that look vaguely correlated with Selenium, which we should take a closer look at:

The correlation coefficient table shows the largest correlations with Selenium to be Protein, at 0.23, and Iron, at 0.16. Potassium trails at 0.08.
I used scikitlearn's LinearRegression to start, and created a first-pass model with an R2 of 0.1 upon k-fold cross-validation. Not to be deterred, I tried a couple pipelines with PolynomialFeatures and the regression. They were either terribly overfit or still low-accuracy. I tried picking and choosing the features, running a model with only the promising-looking high correlation coefficient candidates. Still no dice. At this point, I switched tactics: I decided to try a random forest regression, even though it didn't fit the criteria of the model I was looking for, just to get a sense for what I could theoretically hope for with my regressions.
I ran a few random forests in different configurations, and the best cross-validated accuracy score I could manage was about 0.3. Iron, protein, and occasionally potassium came up as important features across several versions of the model; Vitamins C and D were usually unimportant.
So at this point, I think it's fair to take away that there isn't much predictive ability for selenium with these particular features in this data set. This makes sense from a biochemical standpoint; unlike (for example) the fatty acids, there aren't many other compounds in the data set with similar chemical properties to selenium. I could sit here and grasp at straws to try and spin this model to have positive results, but no one learns anything from that. In fact, I think that demonstrating negative results is important and worthwhile! We now have some support to say something like, "This is information missing from these labels, for which there aren't great proxies. Consumers who care about knowing this information should lobby the USDA for its inclusion."
I don't think I'm entirely done with this dataset. The next step for this project is going to be joining the data with a mercury concentrations dataset, to see if any interesting conclusions (selenium or otherwise) can be drawn about food safety and informed consumer decision-making.
Just for fun, I'll close with this table of the top 10 highest selenium concentrations in the database, so you can make your own informed seafood-purchasing decisions!